
AI For Trading: Exercise:finding pairs (29)
Checking if a pair of stocks is cointegrated
Imports
import numpy as np
import pandas as pd
from sklearn.linear_model import LinearRegression
from statsmodels.tsa.stattools import adfuller
import matplotlib.pyplot as plt
import quiz_tests
/opt/conda/lib/python3.6/site-packages/statsmodels/compat/pandas.py:56: FutureWarning: The pandas.core.datetools module is deprecated and will be removed in a future version. Please use the pandas.tseries module instead.
from pandas.core import datetools# Set plotting options
%matplotlib inline
plt.rc('figure', figsize=(16, 9))# just set the seed for the random number generator
np.random.seed(2018)
# use returns to create a price series
drift = 100
# 高斯分布的概率密度函数(获取1000个数据)
r1 = np.random.normal(0, 1, 1000)
# print(r1)
# print(np.cumsum(r1))
s1 = pd.Series(np.cumsum(r1), name='s1') + drift
s1.plot(figsize=(14,6))
plt.show()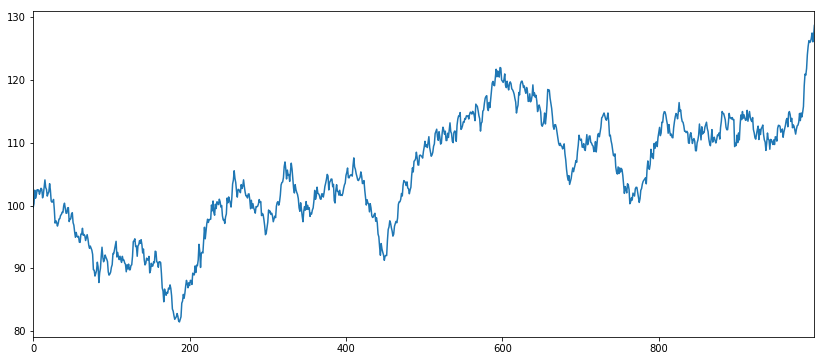
offset = 10
noise = np.random.normal(0, 1, 1000)
s2 = s1 + offset + noise
s2.name = 's2'
pd.concat([s1, s2], axis=1).plot(figsize=(15,6))
plt.show()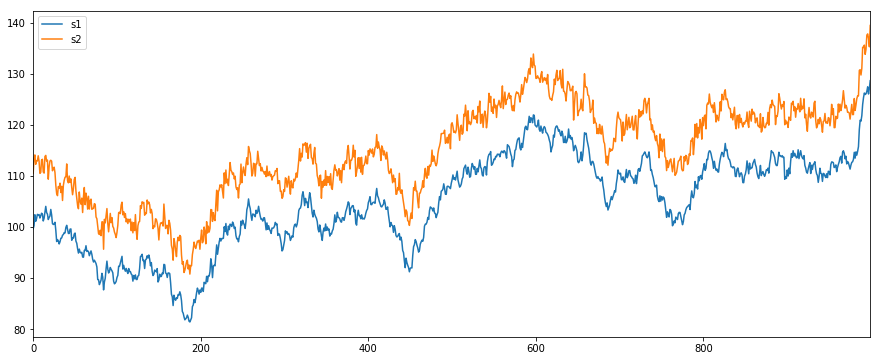
price_ratio = s2/s1
price_ratio.plot(figsize=(15,7))
plt.axhline(price_ratio.mean(), color='black')
plt.xlabel('Days')
plt.legend(['s2/s1 price ratio', 'average price ratio'])
plt.show()
print(f"average price ratio {price_ratio.mean():.4f}")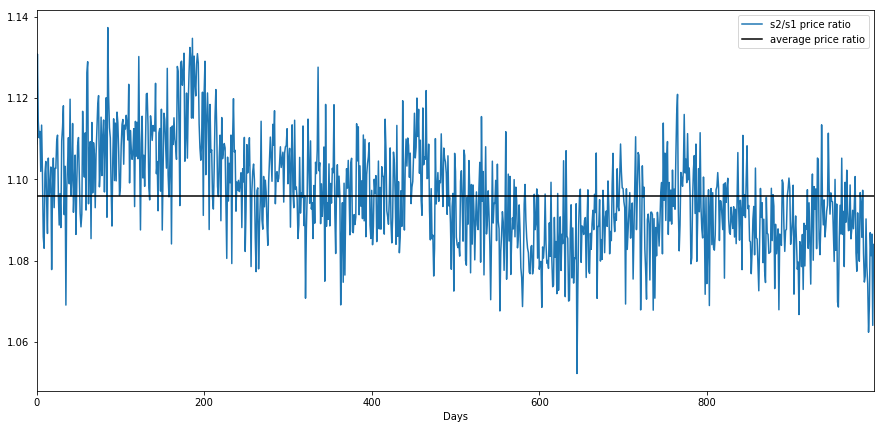
average price ratio 1.0960Calculate hedge ratio with regression
Linear Regression
Note that the LinearRegression().fit() expects 2D numpy arrays. Since s1 and s2 are pandas series, we can use Series.values to get the values as a numpy array. Since these are 1D arrays, we can use numpy.reshape(-1,1) to make these 1000 row by 1 column 2 dimensional arrays
type(s1)pandas.core.series.Seriestype(s1.values)numpy.ndarrays1.values.reshape(-1,1).shape(1000, 1)lr = LinearRegression()
lr.fit(s1.values.reshape(-1,1),s2.values.reshape(-1,1))LinearRegression(copy_X=True, fit_intercept=True, n_jobs=1, normalize=False)hedge_ratio = lr.coef_[0][0]
hedge_ratio1.002234357791276intercept = lr.intercept_[0]
intercept9.753022747192901print(f"hedge ratio from regression is {hedge_ratio:.4f}, intercept is {intercept:.4f}")hedge ratio from regression is 1.0022, intercept is 9.7530Question
Do you think we'll need the intercept when calculating the spread? Why or why not?
Calculate the spread
spread = s2 - s1 * hedge_ratioprint(f"Average spread is {spread.mean()}")Average spread is 9.753022747192906spread.plot(figsize=(15,7))
plt.axhline(spread.mean(), color='black')
plt.xlabel('Days')
plt.legend(['Spread: s2 - hedge_ratio * s1', 'average spread'])
plt.show()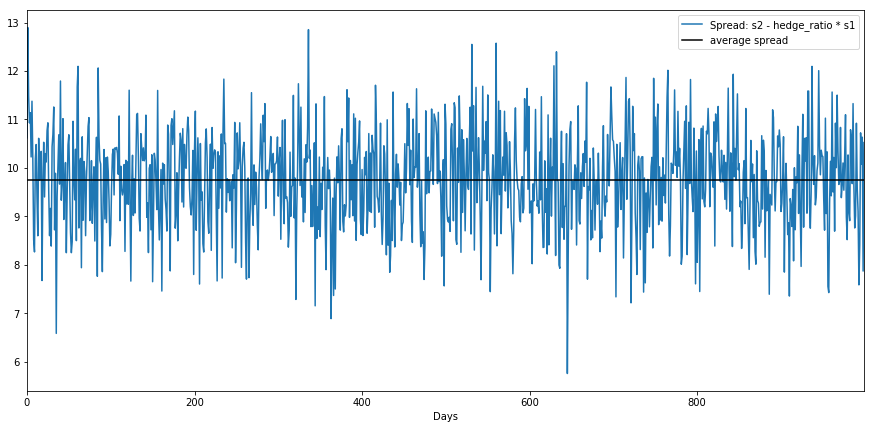
Let's see what we get if we include the intercept of the regression
spread_with_intercept = s2 - (s1 * hedge_ratio + intercept)
print(f"Average spread with intercept included is {spread_with_intercept.mean()}")
Average spread with intercept included is 6.210143510543276e-15spread_with_intercept.plot(figsize=(15,7))
plt.axhline(spread_with_intercept.mean(), color='black')
plt.xlabel('Days')
plt.legend(['Spread: s2 - (hedge_ratio * s1 + intercept)', 'average spread'])
plt.show()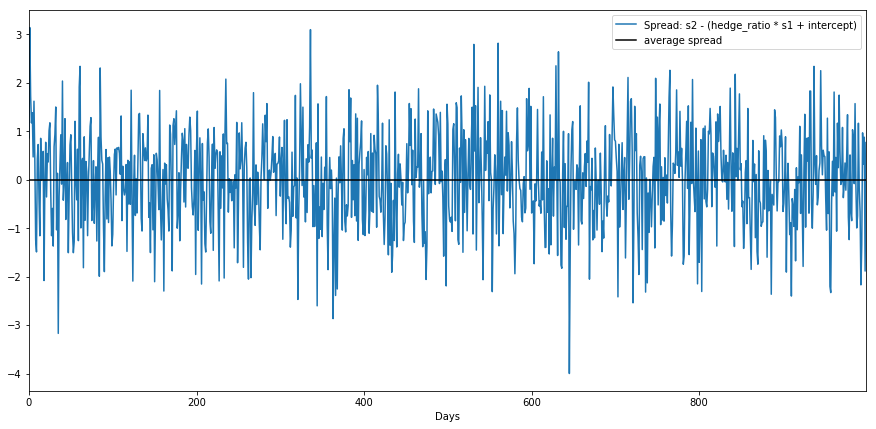
Quiz
Check if spread is stationary using Augmented Dickey Fuller Test
The adfuller function is part of the statsmodel library.
adfuller(x, maxlag=None, regression='c', autolag='AIC', store=False, regresults=False)[source]

adf (float) – Test statistic
pvalue (float) – p-value
...
def is_spread_stationary(spread, p_level=0.05):
"""
spread: obtained from linear combination of two series with a hedge ratio
p_level: level of significance required to reject null hypothesis of non-stationarity
returns:
True if spread can be considered stationary
False otherwise
"""
#TODO: use the adfuller function to check the spread
adf_result = adfuller(spread)
#get the p-value
pvalue = adf_result[1]
print(f"pvalue {pvalue:.4f}")
if pvalue <= p_level:
print(f"pvalue is <= {p_level}, assume spread is stationary")
return True
else:
print(f"pvalue is > {p_level}, assume spread is not stationary")
return False
quiz_tests.test_is_spread_stationary(is_spread_stationary)pvalue 0.0000
pvalue is <= 0.05, assume spread is stationary
Tests Passed# Try out your function
print(f"Are the two series candidates for pairs trading? {is_spread_stationary(spread)}")pvalue 0.0000
pvalue is <= 0.05, assume spread is stationary
Are the two series candidates for pairs trading? True为者常成,行者常至
自由转载-非商用-非衍生-保持署名(创意共享3.0许可证)


